こんにちは松田です。
muninでwindowsを監視する方法をご紹介したいと思います。
各バージョン
- Windows Server 2019
- munin-node-1.6(beta)
munin-nodeのダウンロードと配置
http://www.itflags.co.jp/service/infra/munin-node-for-windows-x64/
からmunin-node-x64-v1.6-bin.zipをダウンロードし、適当なフォルダ(今回はC:\munin)に解凍します。
munin-nodeの設定
munin-node.ini を以下のように修正。
[Plugins]
; Plugin Section, 1 enables plugin, 0 disables
Disk=1
Memory=1
Processes=1
Network=1
MbmTemp=0
MbmVoltage=0
MbmFan=0
MbmMhz=0
SMART=0
HD=0
Cpu=0
SpeedFan=0
External=1
ExternalTimeout=5

[DiskPlugin]
; Default Warning and Critical values for % space used
Warning=85
Critical=95

[ExternalPlugin]
; For External Plugins just add an entry with the path to the program to run
; It doesn't matter what the name of the name=value pair is
;Plugin01=C:\Users\Jory\Documents\Visual Studio Projects\munin-node\src\plugins\python\disk_free.py
;Plugin02=c:\1\runaway.py

[PerfCounterPlugin_processor]
DropTotal=1
Object=Processor
Counter=% Processor Time
CounterFormat=double
CounterMultiply=1.000000
GraphTitle=Cpu
GraphCategory=system
GraphArgs=--upper-limit 200 -l 0
GraphDraw=AREASTACK

[PerfCounterPlugin_disktime_util]
DropTotal=1
Object=LogicalDisk
Counter=% Disk Time
CounterFormat=double
CounterMultiply=1.000000
GraphTitle=% Disk Time
GraphCategory=disk
GraphArgs=--upper-limit 100 -l 0
GraphDraw=LINE
Windowsのパフォーマンスモニターで取得できるものであればPerfCounterPluginでグラフを追加できます。
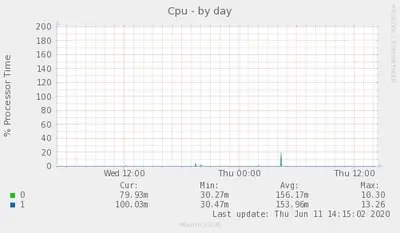
標準のCPUグラフはうまく値がとれなかったので無効にし(Cpu=0)、代わりにPerfCounterPlugin_processorを追加しています。
–upper-limit 200の部分はCPUのコア数によって変えてください。(コア数×100)
また、ディスクのパフォーマンスも見たいので、Disk Utilizationのグラフも追加しています。
サービス登録・起動
以下のコマンドでサービス登録します。
C:\munin\munin-node.exe --installWindowsの管理ツール→サービス から「Munin Node for Windows 1.6.0 (Beta)」を起動。
必要に応じて「セキュリティが強化された Windows ファイアウォール」で4949番ポートを開けます。
確認
Muninマスター側に監視対象のwindowsを登録し、しばらくすると反映されるので、Webブラウザで各グラフが取れていることを確認します。
終わりに
今回はmuninでのwindows監視についてご紹介しました。
標準のグラフに加えてパフォーマンスモニターで取得できるものであれば追加できるので、
以下のようにIISの秒間リクエスト数やSQL Serverのキャッシュヒット率など独自のグラフを追加していくと良いかもしれません。
[PerfCounterPlugin_asp_requests]
DropTotal=1
Object=ASP.NET Applications
Counter=Requests/Sec
CounterFormat=double
CounterMultiply=1.000000
GraphTitle=Requests/Sec
GraphCategory=iis
GraphArgs=--base 1000 -l 0
GraphDraw=LINE
GraphCategory=iis

[PerfCounterPlugin_sqlserver_cachehit]
DropTotal=1
Object=SQLServer:Buffer Manager
Counter=Buffer cache hit ratio
CounterFormat=double
CounterMultiply=1.000000
GraphTitle=Buffer cache hit ratio
GraphCategory=sqlserver
GraphArgs=--upper-limit 100 -l 0
GraphDraw=AREA